-
How to open an FBS account?
Click the ‘Open account’ button on our website and proceed to the Personal Area. Before you can start trading, pass a profile verification. Confirm your email and phone number, get your ID verified. This procedure guarantees the safety of your funds and identity. Once you are done with all the checks, go to the preferred trading platform, and start trading.
-
How to start trading?
If you are 18+ years old, you can join FBS and begin your FX journey. To trade, you need a brokerage account and sufficient knowledge on how assets behave in the financial markets. Start with studying the basics with our free educational materials and creating an FBS account. You may want to test the environment with virtual money with a Demo account. Once you are ready, enter the real market and trade to succeed.
-
How to withdraw the money you earned with FBS?
The procedure is very straightforward. Go to the Withdrawal page on the website or the Finances section of the FBS Personal Area and access Withdrawal. You can get the earned money via the same payment system that you used for depositing. In case you funded the account via various methods, withdraw your profit via the same methods in the ratio according to the deposited sums.
Technical indicators: trading divergences
Divergence is one of the most efficient trading concepts that offer reliable high-quality trading signals. The most curious thing is that it owes its accuracy to the lagging action of oscillators.
Divergences are a big part of many traders’ strategies. Some use them to identify beneficial entry points, others to choose a proper time for exiting their positions. In this tutorial, we will tell you how to spot and trade these cross-functional trading patterns.
Divergence: definition
Let’s start with identifying what is a divergence. Basically, divergence means that the price chart and the technical indicator (oscillator) you use for analyzing the market go in opposite directions. It is the first signal for you to understand that “something” is happening on your chart.
Divergences can be bearish or bullish.
Regular bearish divergence
A bearish divergence occurs when the price creates higher highs on the chart, while your indicator makes lower highs. After such bearish divergence prices normally move downwards: the price needs to catch up with the lower indicator.
Regular bullish divergence
A bullish divergence (also called “convergence”) occurs when the prices create lower lows on the chart, while your indicator shows higher lows. That is the first indication that prices are going to pick up soon: the price needs to catch up with the higher indicator.
Note that when we talk about bearish divergences we are looking at highs in the price chart. When we talk about bullish divergences, we are talking about lows.
In addition to regular divergences, there are so-called hidden divergences.
Hidden bearish divergence
A hidden bearish divergence occurs when the price creates lower highs on the chart, while your indicator makes higher highs. The absence of new highs on the price chart shows that bulls are losing strength. Despite the higher high of the oscillator the movement up is likely a retracement. This movement represents an opportunity to sell at higher levels.
Hidden bullish divergence
A hidden bullish divergence occurs when the price creates higher lows on the chart, while your indicator makes lower lows. The absence of new lows on the price chart shows that bears are losing strength. Despite the lower low of the oscillator the movement down is likely a retracement. This movement represents an opportunity to buy at lower levels.
Experience shows that it’s easier to spot regular divergences than hidden ones.
|
Type |
Price |
Oscillator |
Description and Trading |
|
Regular: expect a reversal |
|||
|
Bearish |
Higher High |
Lower High |
Potential reversal to the downside |
|
Bullish |
Lower Low |
Higher Low |
Potential reversal to the upside |
|
Hidden: expect correction and continuation |
|||
|
Bearish |
Lower High |
Higher High |
Downtrend will likely resume |
|
Bullish |
Higher Low |
Lower Low |
Uptrend will likely resume |
Divergences are normally used for forecasting price corrections and reversals. They are likely to occur before the actual price action. That is something that makes them so effective and allows traders to enter a trade right at the very beginning of the new emerging price move.
How to trade a regular divergence
For trading divergences, you need to insert one of the oscillators into your chart:
- Stochastic,
- Relative Strength Index (RSI),
- Moving Average Convergence Divergence (MACD).
Regardless of the indicator you choose, we recommend you always place Stop Loss orders before making your trading bets. It is no different when you trade divergences. You may put a Stop Loss above the last top on the chart which confirms the occurrence of bearish divergence. If the divergence you are dealing with is bullish, you should place a Stop Loss below the last bottom on the chart.
To find a place for a Take Profit order you will probably need an additional indicator (especially if you trade with RSI and Stochastic). You may use swing analysis or support/resistance levels for setting Take Profit. However, if you prefer using MACD while trading divergences, then you could fully rely on this indicator alone without any supplementary trading tools. When the MACD histogram crosses the signal line upside down, it’s a signal to close a bullish position. When the MACD histogram crosses the signal line bottom up, it’s a signal to close the bearish position.
Divergence trade with MACD oscillator
Here is an example of divergence trade with MACD oscillator.
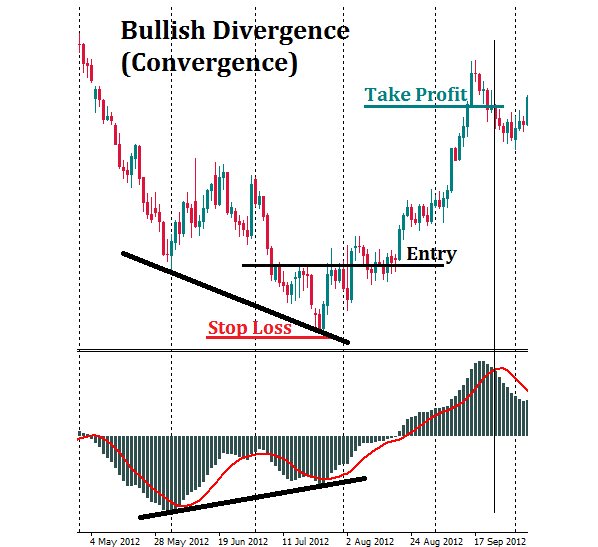
Suppose you found a bullish divergence (convergence) between the MACD and the price chart. In addition, you notice a bullish crossover in the MACD window. You use this price divergence as a signal to open a long position. A Stop Loss order should be placed below the last bottom of the price. Close your trade when the bearish crossover on the MACD oscillator is formed.

2023-07-19 • Updated
Other articles in this section
- Structure of a Trading Robot
- Building a Trading Robot without Programming
- How to Launch Trading Robots in MetaTrader 5?
- Algorithmic Trading: What Is It?
- Fibonacci Ratios and Impulse Waves
- Guidelines of Alternation
- What is a triangle?
- Double Three and Triple Three patterns
- Double Zigzag
- Zig Zag and Flat Patterns in Trading
- Advanced techniques of position sizing
- Truncation in the Elliott Wave Theory
- Ichimoku
- What is an extension?
- Ending Diagonal Pattern
- How to trade gaps
- Leading diagonal pattern
- Wolfe waves pattern
- Three drives pattern
- Shark
- Butterfly
- Crab Pattern
- Bat
- Gartley
- ABCD Pattern
- Harmonic patterns
- What is an impulse wave?
- Motive and corrective waves. Wave degrees
- Introduction to the Elliott Wave Theory
- How to trade breakouts
- Trading Forex news
- How to place a Take Profit order?
- Risk management
- How to place a Stop Loss order?


