-
How to open an FBS account?
Click the ‘Open account’ button on our website and proceed to the Personal Area. Before you can start trading, pass a profile verification. Confirm your email and phone number, get your ID verified. This procedure guarantees the safety of your funds and identity. Once you are done with all the checks, go to the preferred trading platform, and start trading.
-
How to start trading?
If you are 18+ years old, you can join FBS and begin your FX journey. To trade, you need a brokerage account and sufficient knowledge on how assets behave in the financial markets. Start with studying the basics with our free educational materials and creating an FBS account. You may want to test the environment with virtual money with a Demo account. Once you are ready, enter the real market and trade to succeed.
-
How to withdraw the money you earned with FBS?
The procedure is very straightforward. Go to the Withdrawal page on the website or the Finances section of the FBS Personal Area and access Withdrawal. You can get the earned money via the same payment system that you used for depositing. In case you funded the account via various methods, withdraw your profit via the same methods in the ratio according to the deposited sums.
ABCD Pattern
The ABCD is a basic harmonic pattern. All other patterns derive from it. The pattern consists of 3 price swings. The lines AB and CD are called “legs”, while the line BC is referred to as a correction or a retracement. AB and CD tend to have approximately the same size.
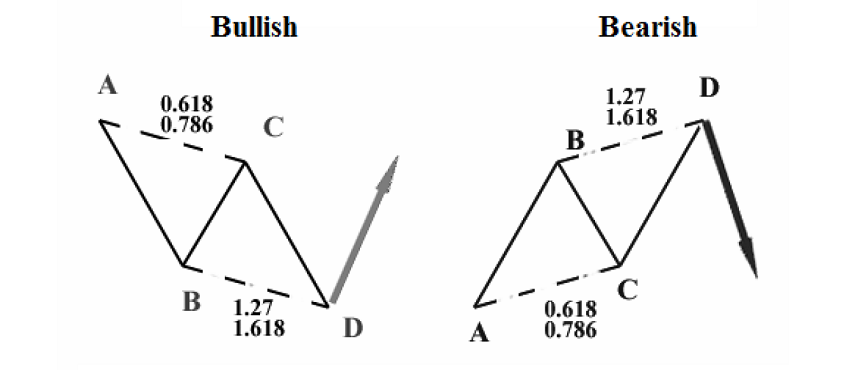
A bullish ABCD pattern follows a downtrend and means that a reversal to the upside is likely. A bearish ABCD pattern is formed after an uptrend and signals a potential bearish reversal at a certain level. The rules for trading bullish and bearish ABCD patterns are the same, you will just need to take into account the direction of the pattern you trade and the movement of the market it predicts.
There are several types of ABCD pattern (all the 3 patterns at the picture are bullish).
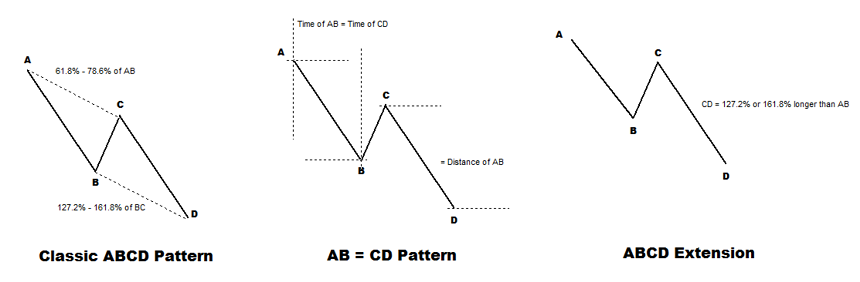
In the classic one, the point C should be at 61.8%-78.6% of AB (Use Fibonacci retracement tool on AB: the point C should be close to 61.8%). The point D, in its turn, should be at the 127.2%-161.8% Fibonacci expansion of BC.
Notice that a 61.8% retracement at the point C tends to result in the 161.8% projection of BC, while a 78.6% retracement at the C point will lead to the 127% projection.
There is also the so-called AB=CD pattern. Here CD has exactly the same length as AB. In addition, it takes the market the equal time to travel from A to B as from C to D. As a Result, AB and CD have the same angle. This type of ABCD pattern is seen quite often and is popular among traders.
The third type is when CD is the 127.2%-161.8% extension of AB. CD can be even 2 times (or more) bigger than AB. There actually are some signs that can hint that CD will be much longer than AB. They are a gap after point C or big candlesticks near point C.
How to trade ABCD pattern
The key thing you should remember is that you can enter the trade only after the price reached the point D.
Study the chart looking at the price’s highs and lows. It may be helpful to use ZigZag indicator (Insert – Indicators – Custom – ZigZag) that marks the chart’s swings.
Watch the price as it forms AB and BC. In a bullish ABCD, C must be lower than A and should be the intermediate high after the low at B. Point D must be a new low below B.
When the market arrives at a point, where D may be situated, don’t rush into a trade. Use some techniques to make sure that the price reversed up (or down if it’s a bearish ABCD). The best scenario is a reversal candlestick pattern. A buy order may be set at or above the high of the candle at point D.
Take profit levels
Here are the target levels for trading the ABCD pattern.
TP1: 38.2% retracement of AD
TP2: 61.8% retracement of AD
TP3: point A
We recommend using these levels together with support and resistance you identify at the chart using various tools of technical analysis. Don’t forget to have a look at senior timeframes when you hunt for support and resistance levels.
If the price moved to TP1 fast, the odds are that it will continue towards TP2. On the contrary, if the price is slow to get to TP1, this might mean that it will be the only TP level you’ll get.
There are many cases when the market reversed after AC=CD pattern going beyond point A.
As for Stop Loss, there are no special recommendations. You can put a Stop Loss in line with your risk management rules.
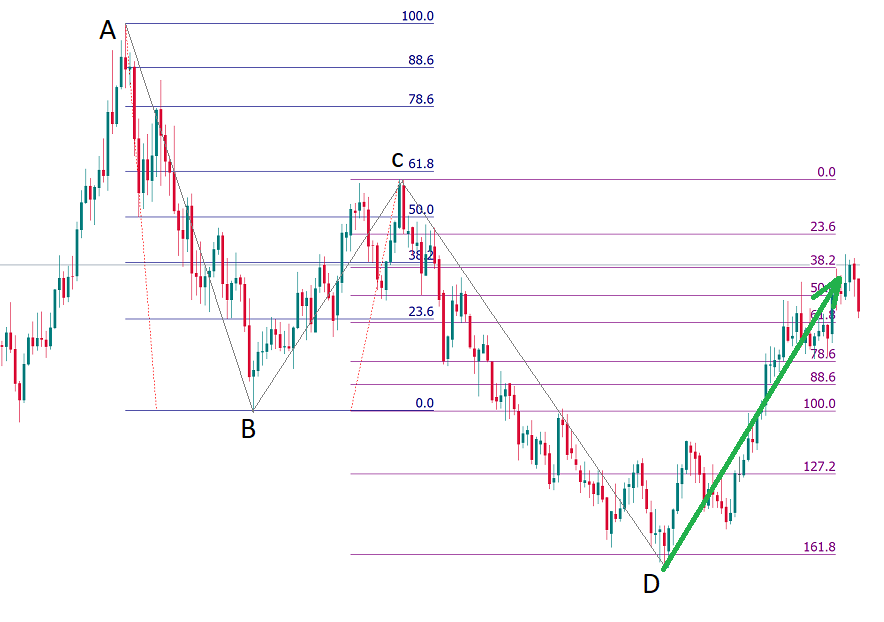
Here's an example of the ABCD patterns on the chart:
Conclusion
You can find many ABCD pattern on one chart. The rules for trading each of them are as explained above. Make sure that you know how to apply Fibonacci tools correctly an follow all our tips.

2022-05-17 • Updated
Other articles in this section
- Structure of a Trading Robot
- Building a Trading Robot without Programming
- How to Launch Trading Robots in MetaTrader 5?
- Algorithmic Trading: What Is It?
- Fibonacci Ratios and Impulse Waves
- Guidelines of Alternation
- What is a triangle?
- Double Three and Triple Three patterns
- Double Zigzag
- Zig Zag and Flat Patterns in Trading
- Advanced techniques of position sizing
- Truncation in the Elliott Wave Theory
- Ichimoku
- What is an extension?
- Ending Diagonal Pattern
- How to trade gaps
- Leading diagonal pattern
- Wolfe waves pattern
- Three drives pattern
- Shark
- Butterfly
- Crab Pattern
- Bat
- Gartley
- Harmonic patterns
- What is an impulse wave?
- Motive and corrective waves. Wave degrees
- Introduction to the Elliott Wave Theory
- How to trade breakouts
- Trading Forex news
- How to place a Take Profit order?
- Risk management
- How to place a Stop Loss order?
- Technical indicators: trading divergences


