-
How to start trading?
If you are 18+ years old, you can join FBS and begin your FX journey. To trade, you need a brokerage account and sufficient knowledge on how assets behave in the financial markets. Start with studying the basics with our free educational materials and creating an FBS account. You may want to test the environment with virtual money with a Demo account. Once you are ready, enter the real market and trade to succeed.
-
How to open an FBS account?
Click the 'Open account' button on our website and proceed to the Trader Area. Before you can start trading, pass a profile verification. Confirm your email and phone number, get your ID verified. This procedure guarantees the safety of your funds and identity. Once you are done with all the checks, go to the preferred trading platform, and start trading.
-
How to withdraw the money you earned with FBS?
The procedure is very straightforward. Go to the Withdrawal page on the website or the Finances section of the FBS Trader Area and access Withdrawal. You can get the earned money via the same payment system that you used for depositing. In case you funded the account via various methods, withdraw your profit via the same methods in the ratio according to the deposited sums.
Motive and corrective waves. Wave degrees
In the first article about the Elliott Wave Principle, we found out that there are waves on the markets. Let's go on! This time we'll focus on one of the main pillars of the EWP, such as motive and corrective waves.
What's a motive wave?
Simply put, a motive wave is a price movement in the direction of the main trend. In other words, each motive wave is a step forward during a rally. Motive waves always subdivide into five smaller waves according to certain rules.
And what about corrective waves?
As the name implies, a corrective wave comes after a motive wave. So, during a trend, motive and corrective waves form one after the other. While a motive wave is a move forwards, a corrective wave is a step back within a trend.
Patterns
All Elliott wave patterns are classified into motive and corrective waves.
The motive waves are:
The corrective waves are:
- Zigzag
- Flat
- Triangle
- Double / Triple Zigzag
- Double / Triple Three
There are rules and guidelines for each of these patterns, which we're going to examine in the next articles.
How it works
Let's have a look at the real wave count below. There's an amazing bullish rally in USDTRY and we can identify the motive and the corrective waves. As we can see, there are three motive waves (in red) and two corrective waves (in blue) that form a pattern called ‘impulse’. However, there's another thing we should mention.
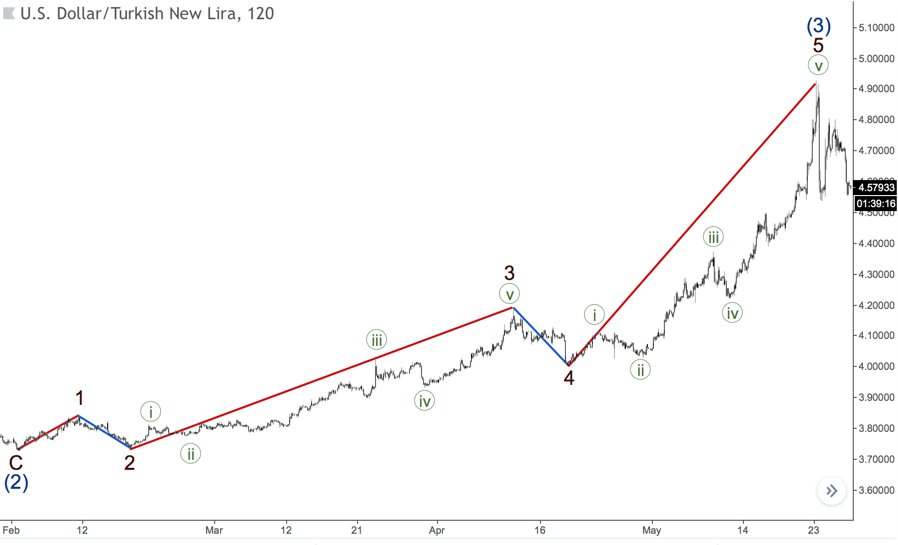
Wave Degrees
Can you see the smaller waves inside each motive or corrective wave at the chart above? As we know from the last article, Elliott waves are like a Russian nesting doll (Matryoshka). That means that each wave is built of smaller waves and, at the same time, each wave is a part of a bigger wave.
So, on every single chart, you can have motive and corrective waves that differ by size. If you want to do a wave count, you should identify these waves by certain rules and guidelines.
Real life
For the better understanding of wave degrees, let's have a look at the chart below. There's an upward wave, which I labelled as ((i)). After this wave, we have a downward correction, which is the wave ((ii)). So, we found two waves.
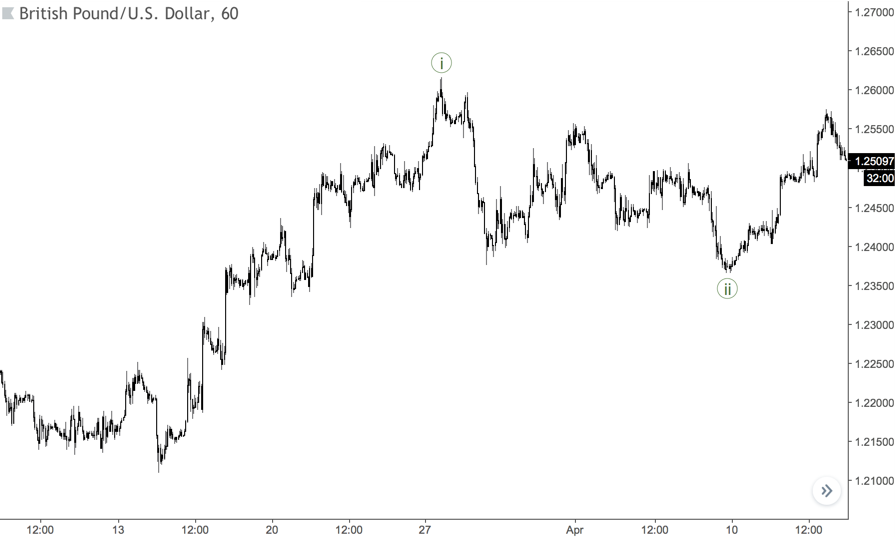
However, inside the wave ((i)) we can see some smaller waves, which are one degree lower. At the same time, there are also smaller waves inside the wave ((ii)). So, now we labelled waves of two degrees, but let's go further.
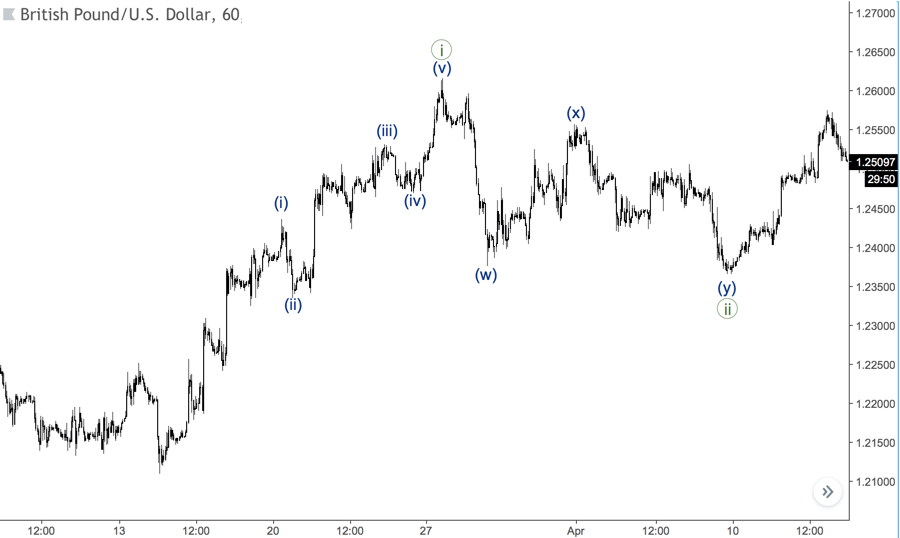
As you can see in the next chart, there are even smaller waves. This means that we can subdivide each wave into smaller waves until we reach the lowest timeframe possible. Sometimes, you can see beautiful waves like shown in books, but you can also find quite ugly waves as well, especially on the intraday timeframes.
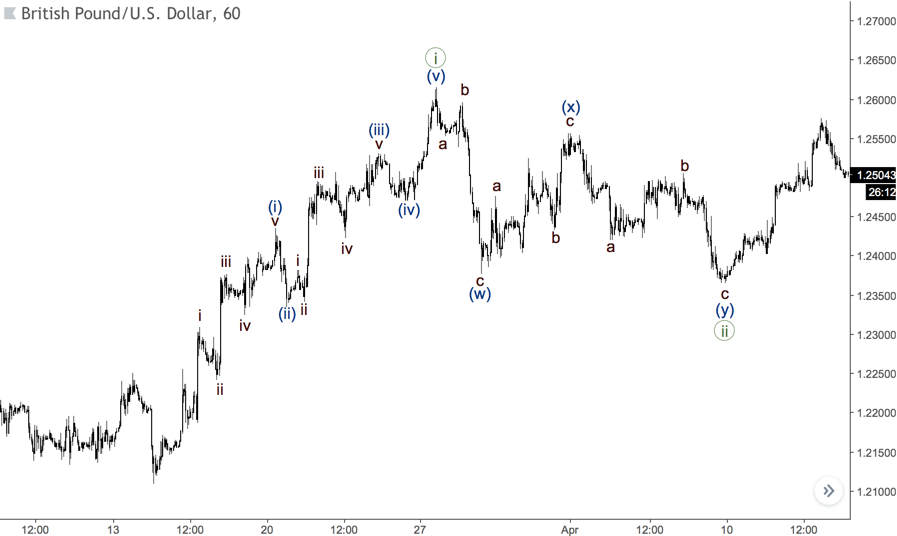
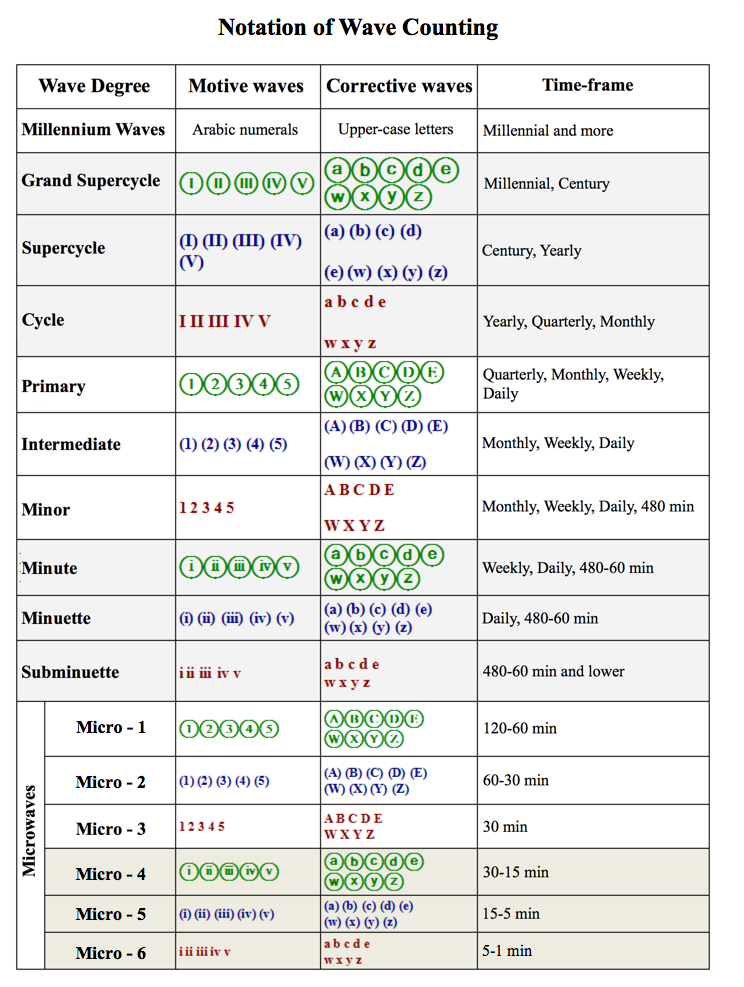
Elliott Wave 'language'
Have you noticed that there're different styles of labelling for each wave degree on the charts above? This is called notation of wave counting. We use it to specify wave degrees on the chart and also to improve the communication between analysts. If you don't use wave notation, it'll be quite difficult to explain your wave count to someone.
As you can see from the table below, there's a sequence of numbers (for motive waves) and letters (for corrections).
For Motive waves, we use sets of three Roman and Arabic numerals, which alternate one after the other. Corrections are labelled with alternating sets of three upper-case and lower-case letters. Under the same wave degree, we use Roman numerals and lower-case letters, or Arabic numerals and upper-case letters.
Where can we find waves?
Everywhere. You can do a wave count on every single market. However, it's better to choose markets with a good liquidity because of the nature of the EWP. If we try to count at an unpopular market with a lot of gaps and ugly bars, well... most likely we'll experience some issues with that.
Also, it's better for beginners to count trend markets rather than consolidating once. Why? Just because if we have such a long consolidation, which has been developing for many years, then we're likely going to count a pretty difficult correction structure. Is so, there's a good chance to be wrong because the more your wave count becomes complicated, the greater the risk.

2022-04-04 • Updated
Other articles in this section
- Structure of a Trading Robot
- Building a Trading Robot without Programming
- How to Launch Trading Robots in MetaTrader 5?
- Algorithmic Trading: What Is It?
- Fibonacci Ratios and Impulse Waves
- Guidelines of Alternation
- What is a triangle?
- Double Three and Triple Three patterns
- Double Zigzag
- Zig Zag and Flat Patterns in Trading
- Advanced techniques of position sizing
- Truncation in the Elliott Wave Theory
- Ichimoku
- What is an extension?
- Ending Diagonal Pattern
- How to trade gaps
- Leading diagonal pattern
- Wolfe waves pattern
- Three drives pattern
- Shark
- Butterfly
- Crab Pattern
- Bat
- Gartley
- ABCD Pattern
- Harmonic patterns
- What is an impulse wave?
- Introduction to the Elliott Wave Theory
- How to trade breakouts
- Trading Forex news
- How to place a Take Profit order?
- Risk management
- How to place a Stop Loss order?
- Technical indicators: trading divergences


