-
How to open an FBS account?
Click the ‘Open account’ button on our website and proceed to the Personal Area. Before you can start trading, pass a profile verification. Confirm your email and phone number, get your ID verified. This procedure guarantees the safety of your funds and identity. Once you are done with all the checks, go to the preferred trading platform, and start trading.
-
How to start trading?
If you are 18+ years old, you can join FBS and begin your FX journey. To trade, you need a brokerage account and sufficient knowledge on how assets behave in the financial markets. Start with studying the basics with our free educational materials and creating an FBS account. You may want to test the environment with virtual money with a Demo account. Once you are ready, enter the real market and trade to succeed.
-
How to withdraw the money you earned with FBS?
The procedure is very straightforward. Go to the Withdrawal page on the website or the Finances section of the FBS Personal Area and access Withdrawal. You can get the earned money via the same payment system that you used for depositing. In case you funded the account via various methods, withdraw your profit via the same methods in the ratio according to the deposited sums.
How to trade breakouts
There are a lot of technical tools that help to determine important levels. Traders draw these levels through previous highs and lows, use Fibonacci retracements and pivot points, trend lines etc. Important levels act as support/resistance for the price. The more times the price touches such level, the more valid level you managed to find.
When the price breaks an important level, it means that it should continue moving in that direction. However, that will happen only in case of a real breakout and this doesn’t happen every time. In many cases, a price goes above an important level but doesn’t manage to sustain this movement. It gets back to its previous trading range, so the breakout turns out to be false.
How can we know if a breakout is true or false?
Right after the price moves through a level, it can be very difficult to say. At the same time, it’s obvious that a trader should trade a real breakout and a false breakout differently.
Note that such price patterns like channels, triangles and flags can be truly valuable for the identification of potential breaking points. The more important the level is, the harder it will be for a price to break it. At the same time, remember that a real break of such level will have a more far-going consequence.
Trading false breakouts
It is worth to say that there are more false breaks than true ones. Novice traders tend to rush into the breakout trade without a real confirmation of a break but are pushed out of the market by larger players.
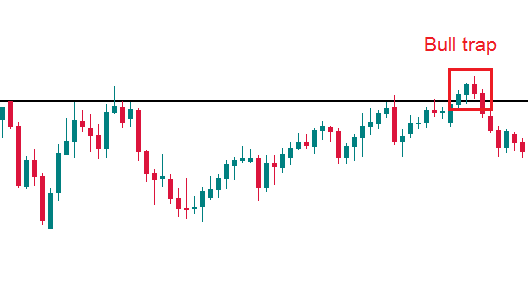
When after a breakout attempt, the price returns to the previous trading range and fixes there, it is a false breakout. It may happen instantly after a price pierces an important level or after up to 4 candles beyond the level. The latter is referred to as bull/bear trap. Reversal candlestick patterns in the vicinity of a “breakout” level give reliable hints that a break has failed.
False breakouts are best traded in the direction of the trend. We highly recommend you analyzing H1 and higher timeframes as at smaller ones (M30, M15, etc.) the price action is too chaotic.
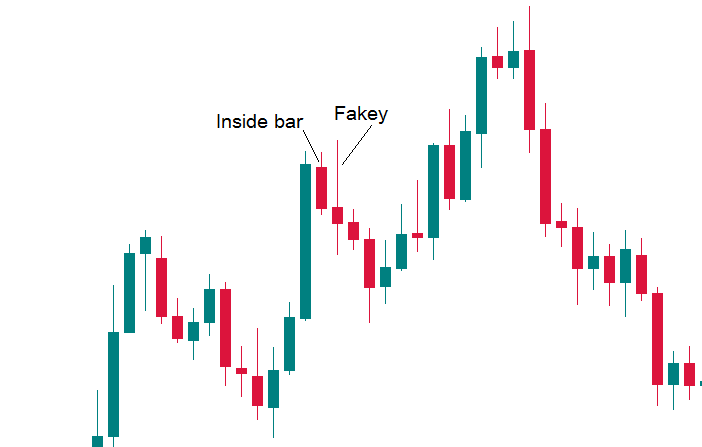
A particular case to mention is the so-called Fakey pattern or, in other words, a false breakout of an inside bar. An inside bar is a candlestick, which is completely covered by the previous candlestick. If you see an inside bar and then its break ends up in a pin bar candle, it’s a strong signal that the price will move in the direction opposite the false break.
Trading a real breakout
If you decided to enter the market in the direction of a breakout, do it cautiously. In many cases simply putting a pending order, for example, a Sell Stop a bit below a support level, may trigger your entry order and then lead to a loss if the price returns higher.
To solve this problem, some players put entry orders for a short position below the breakout candle. Even so, the risk of a false breakout remains high.
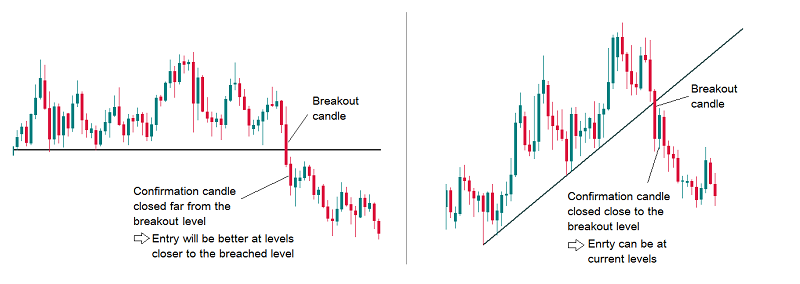
In order to enhance your chance of success, you should look at the breakout candle. Its length should exceed the average at least 1.5 times. It should also have a full body (it can’t be a doji or a pin bar). Even if the candle fits this description and closes below the support level, wait for the second candle – the confirmation candle. It should be smaller than the breakout candle and close below the breakout level as well.
If the confirmation candle closed near the breakout level, we may enter at the market price. If the candle closed far from the breakout level, we put a Sell Limit closer to the breakout level.
Patience is often the best option. In chart patterns like ‘Head and Shoulders’ there’s often a retest of a broken level.
If you decided to trade on a breakout, it means that you are taking a higher risk than otherwise. This higher risk should be reflected in your risk management: it’s recommended to move Stop Loss order to break-even level fast (i.e. move your Stop Loss to a point where your trade will close with 0 loss faster than during range and trend trading). The risk/reward ratio can be up to 1:4, 1:5. You may use scaling out (partially close the position as the price moves in your favor).
Don’t forget about such factors as market’s sentiment, economic news, and common sense. These things can give you hints about the nature of what is happening at the chart.
To sum up, “confirmation” should be your magical word. It doesn’t matter whether we talk about a false or a real break. Real breakout requires more confirmations than the false ones.

2024-03-04 • Updated
Other articles in this section
- Structure of a Trading Robot
- Building a Trading Robot without Programming
- How to Launch Trading Robots in MetaTrader 5?
- Algorithmic Trading: What Is It?
- Fibonacci Ratios and Impulse Waves
- Guidelines of Alternation
- What is a triangle?
- Double Three and Triple Three patterns
- Double Zigzag
- Zig Zag and Flat Patterns in Trading
- Advanced techniques of position sizing
- Truncation in the Elliott Wave Theory
- Ichimoku
- What is an extension?
- Ending Diagonal Pattern
- How to trade gaps
- Leading diagonal pattern
- Wolfe waves pattern
- Three drives pattern
- Shark
- Butterfly
- Crab Pattern
- Bat
- Gartley
- ABCD Pattern
- Harmonic patterns
- What is an impulse wave?
- Motive and corrective waves. Wave degrees
- Introduction to the Elliott Wave Theory
- Trading Forex news
- How to place a Take Profit order?
- Risk management
- How to place a Stop Loss order?
- Technical indicators: trading divergences


