How I Analyze Price On Clean Charts
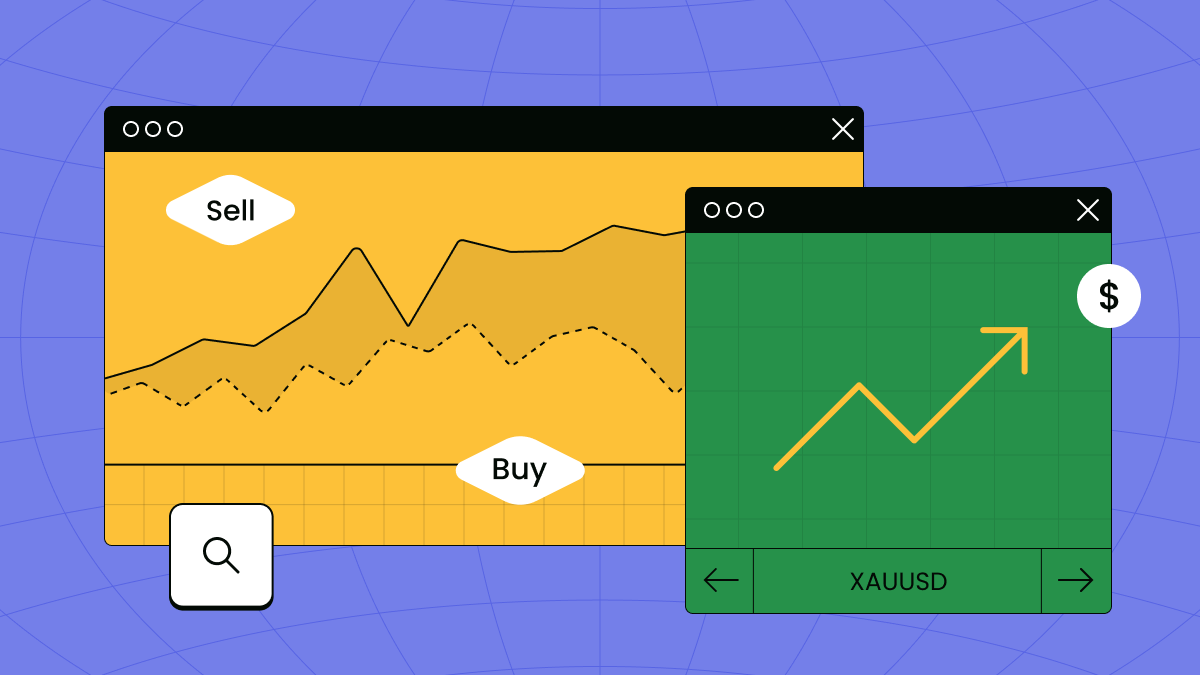
Hello, traders! This article will give some thoughts on clean Forex chart analysis. As a long-time trader, I often come across questions about how to analyze clean charts, and I think this is one of the crucial points that needs attention as Forex still attracts new traders - beginners who may find the following tips helpful.
With that out of the way, let’s dive into the intricacies of clean charts analysis.
Why I Use “Clean” Charts & How to Set Them Up
If you want to master trading, learn to analyze clean charts. You will always have time to crowd your charts with various indicators, trendlines, etc. However, and I tell you this from my own experience, the more you trade, the more you realize the importance of clean charts and how they can improve your performance.
I use clean charts to focus on the price action and identify key support and resistance levels. I can see the market trends and make better trading decisions with everything unnecessary removed from my charts.
Clean charts are also a great help in avoiding analysis paralysis - something every trader experiences when too many indicators and too many lines lead to confusion and indecision. It's not the best way to trade, trust me.
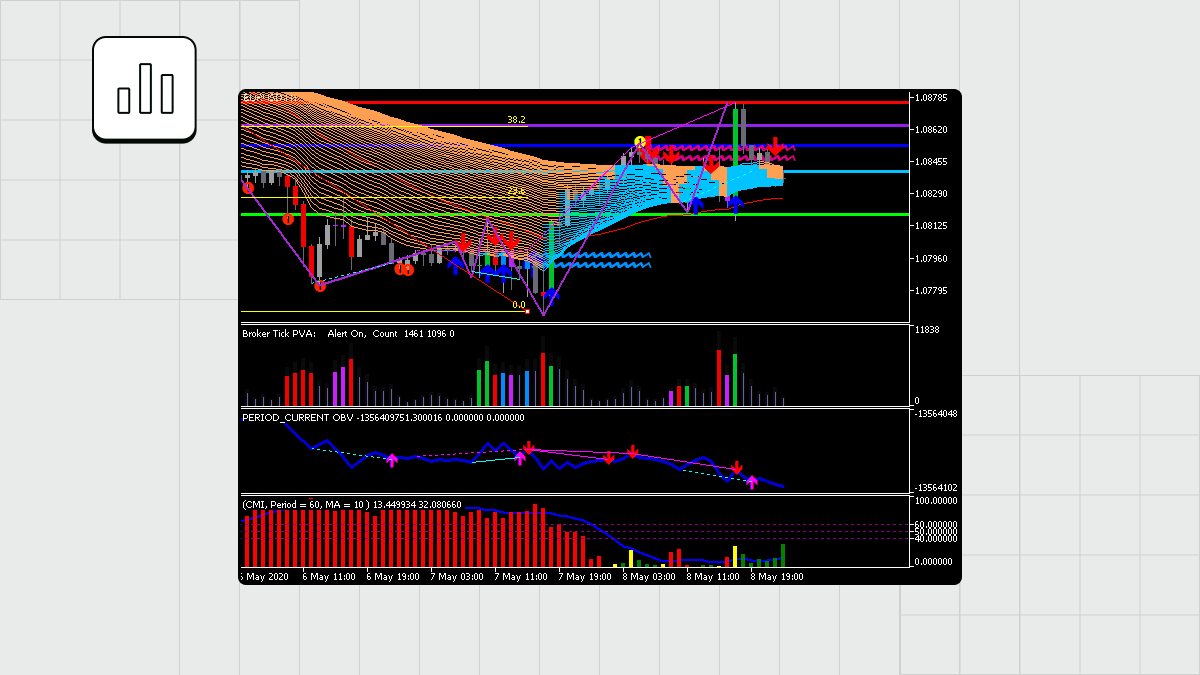
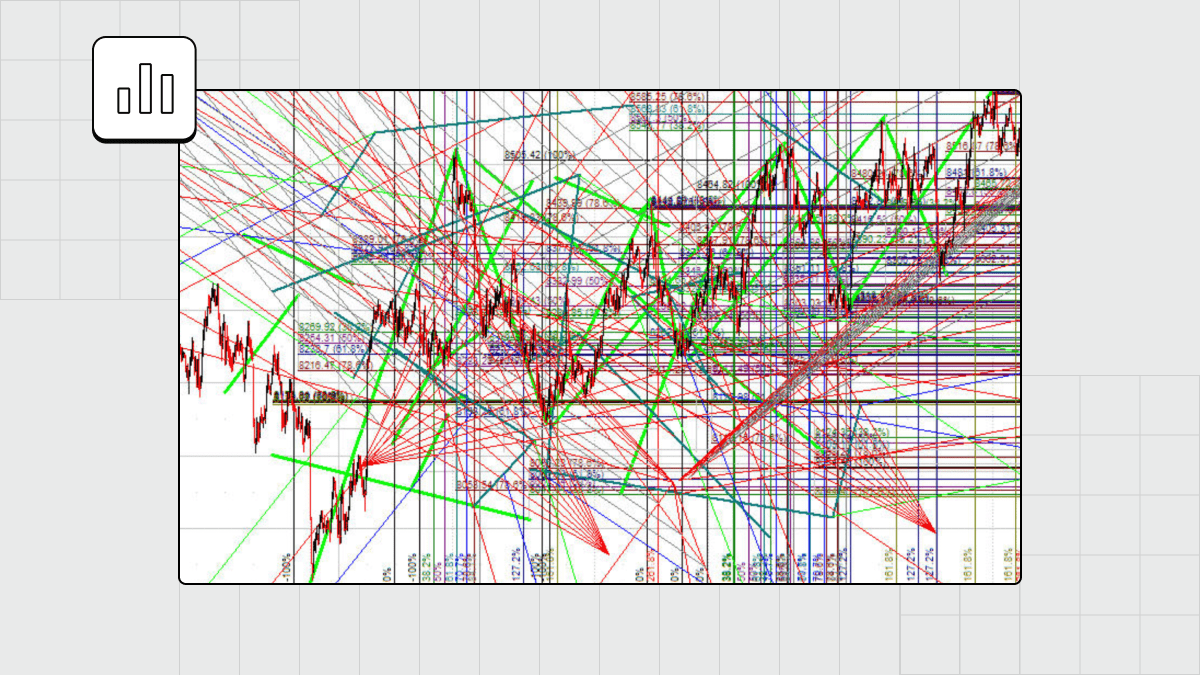
pic: Do you really think you can say where the price goes with this mess of a chart?
For clean Forex chart analysis, I only keep the essential elements such as moving averages, Fibonacci retracement levels, and key support and resistance levels. I also use candlestick charts for a clear visual representation of price movements.
I then set up my charts with a clean color scheme. I prefer using only a few colors to differentiate between different elements. The white background with green and red candles also works well for me, showing bullish and bearish price movements. The simplicity of this color scheme helps you focus and minimize distractions.
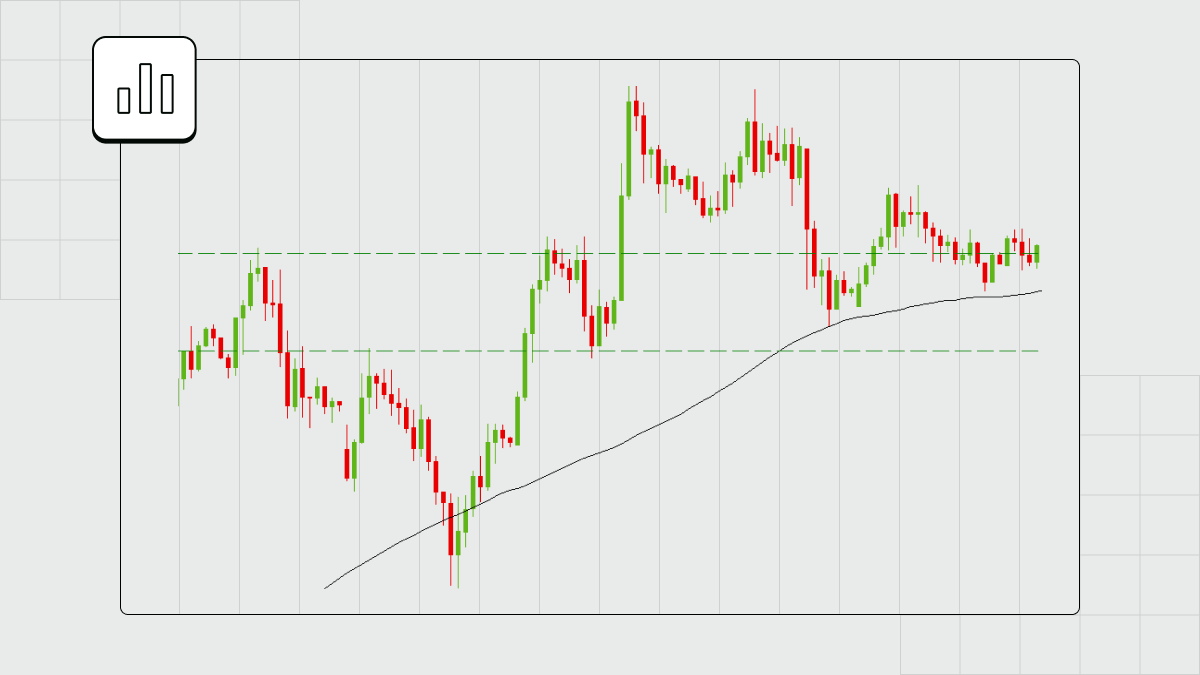
pic: In most cases, that's the number of lines you need for an accurate chart analysis.
I also use a clean and simple layout for my charts. I organize the elements in a way that is easy to understand and visually appealing. This helps me to analyze market trends and make informed trading decisions quickly.
Finally, I use various timeframes to get a comprehensive view of the market. My typical choice includes daily, 4-hour, and 1-hour charts to identify long-term trends and short-term price movements.
Wrapping this part up, I would like to emphasize that clean charts have significantly improved my trading performance. They help me focus and avoid unnecessary distractions, which is one of the key conditions to achieve positive results.
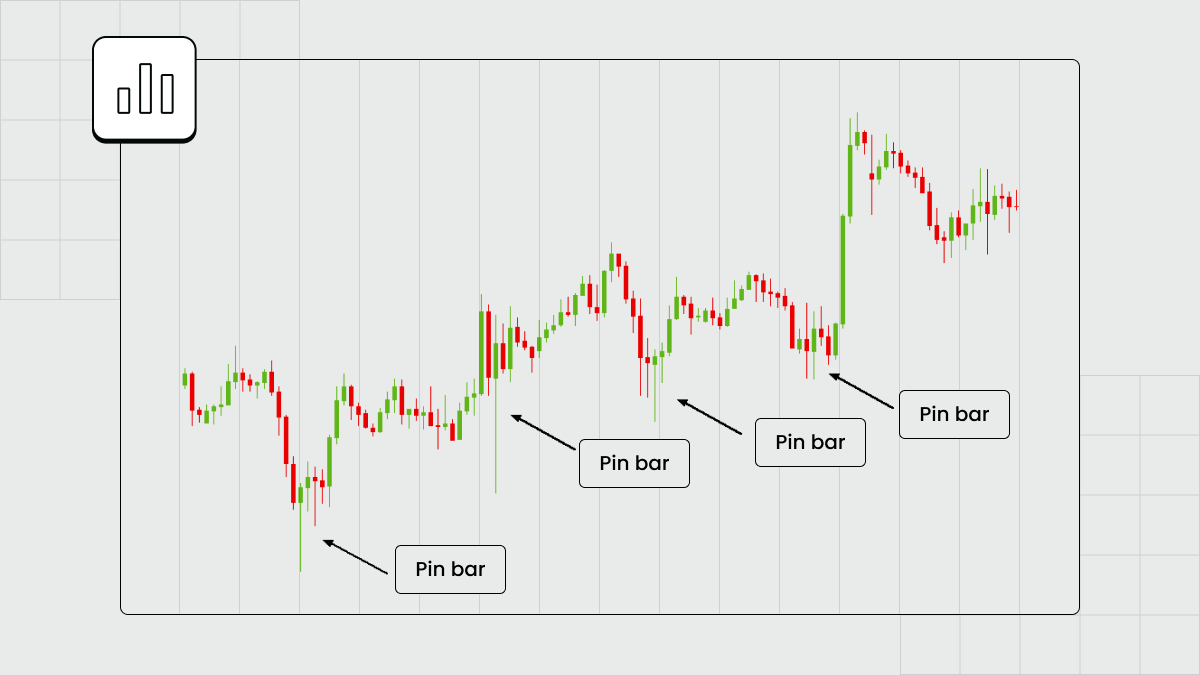
pic: Clean chart
How I Analyze Clean Price Charts
So now, let’s look at what I do when I analyze price charts. Maybe some of it will give you ideas that you will apply to your Forex chart analysis.
First, I focus on the overall market trend. I look for key support and resistance levels, often identified by previous price highs and lows. These levels help me understand the potential direction of the market and make informed trading decisions.
Then, I look at the price action: I aim to find patterns such as head and shoulders, double tops or bottoms, and other chart patterns that can signal potential trend reversals or continuations. This helps me to anticipate possible price movements and adjust my trading strategy accordingly.
I use moving averages to identify the general direction of the trend and potential areas of support or resistance. Crossovers between different moving averages can indicate likely changes in the trend.
Another important aspect of analyzing clean price charts is identifying key Fibonacci retracement levels. These levels help me identify potential areas of support or resistance based on the Fibonacci sequence, a standard tool used in technical analysis.
Pay attention to volume for valuable insights into market sentiment and potential trend reversals. High volume during a price movement can indicate strong market participation; low volume can indicate a lack of interest in a particular direction.
When you analyze clean price charts, you focus on a trend, support and resistance levels, chart patterns, moving averages, Fibonacci retracement levels, and volume. If you keep your chart cluttered with tons of unnecessary details, you will unlikely make better trading decisions. So, if you’re looking for precise market analysis, go for clean chart analysis.
Price Action Trading System
Price action trading is a popular and widely used trading system that focuses on analyzing clean price charts. This approach emphasizes the use of historical price movements and patterns to predict future price movements rather than relying on indicators or other technical tools.
Price action trading is about using price movements as the only source of the information you need to make trading decisions. Price action traders look for patterns, trends, support and resistance levels, and other key price points to identify potential trading opportunities.
One of the key principles of price action trading is that historical price movements tend to repeat themselves, and by studying these patterns, traders can anticipate potential future price movements. Price action traders often use candlestick patterns, chart patterns, and trend lines to identify their trades' possible entry and exit points.
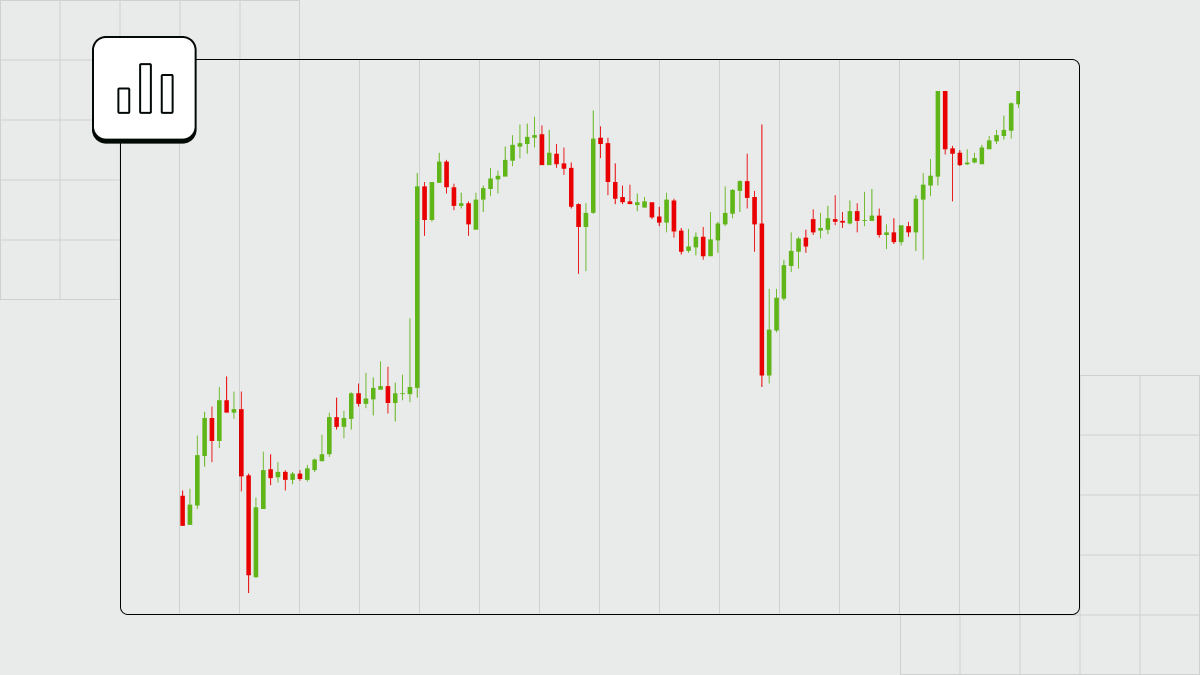
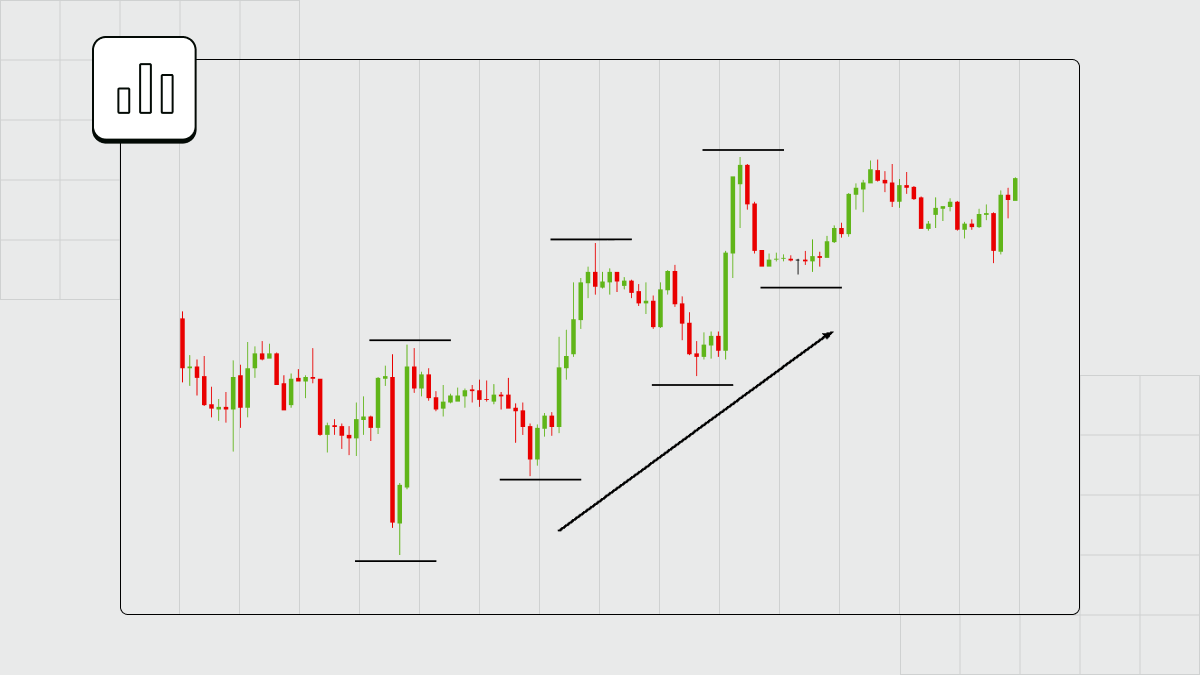
pic: Higher highs and higher lows signal an uptrend
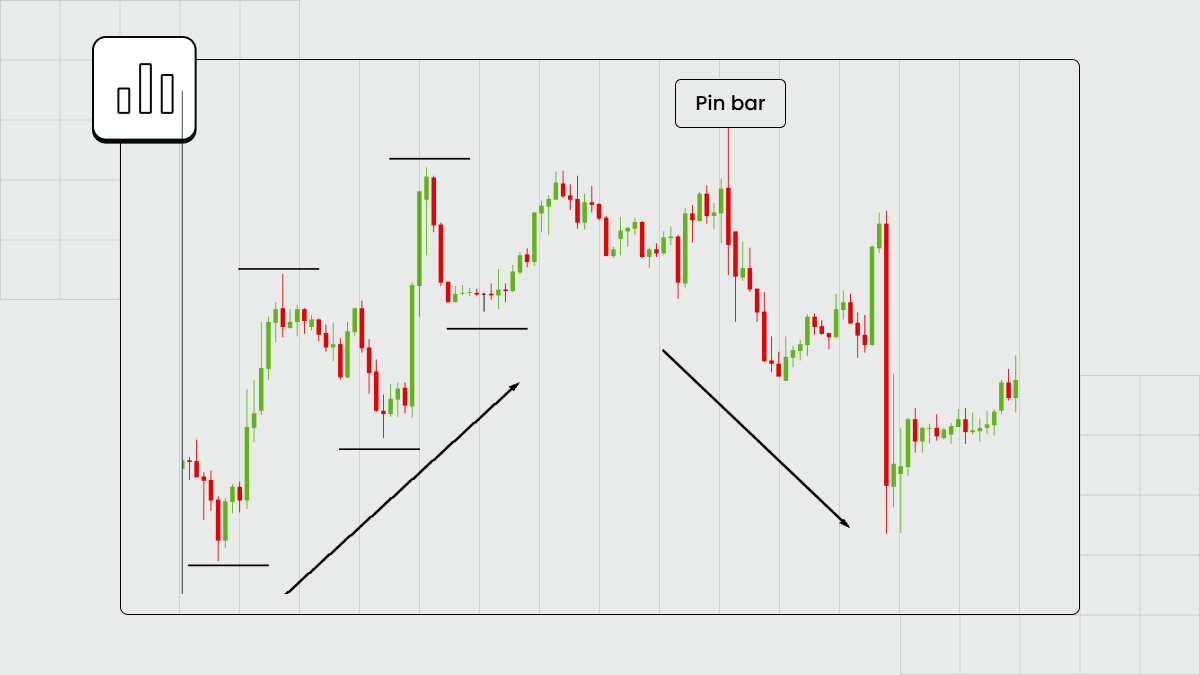
pic: Pin bar reversal kicks off a downtrend signaled by lower highs and lower lows.
To feel confident during price action trading, you need to understand market psychology and sentiment: pay close attention to how price reacts at certain levels, as this can provide valuable insights into market sentiment and potential trend reversals.
Price action trading is simple yet effective. It allows you to make informed decisions based on an accurate analysis of price movements. If you learn to focus on the most critical elements of the market, you will be able to develop a deep understanding of market dynamics and make profitable trading decisions.
Smart Money Concepts (SMC)
Smart Money Concepts (SMC) in trading refers to the idea that large institutional investors, such as hedge funds, banks, and other financial institutions, significantly impact the movement of financial markets. These institutional investors are often referred to as "smart money" because they have access to extensive resources, advanced technology, and expert analysis that give them a competitive edge in the market.
When applied to price action trading, smart money concepts are crucial in identifying potential market trends. To anticipate future market movements, price action traders often look for signs of smart money activity in the market, such as large volume trades, significant price moves, and unusual price patterns.
Smart money concepts emphasize the importance of following the direction of institutional investors, as they often have the power to move the market in a particular direction. As a price action trader, you can gain valuable insights into market sentiment and potential trend reversals by analyzing the behavior of smart money.
Finally, if you understand smart money concepts, you will be less likely to fall victim to market manipulation or false breakouts, as institutional investors often can influence market movements for their own benefit.
My opinion is that incorporating smart money concepts into price action trading can benefit your trading as you will learn to understand the market better.
Price Action Indicators
I know what you’re thinking: what do indicators have to do with the concept of clean charts price analysis? You have your point; however, I must warn you not to take the idea too literally. Clean chart analysis is about to help you get rid of a mish-mash approach to chart management. That’s it. It’s not about leaving you with no helpful tools to trade. Tools like the ones I will touch upon below.
pic: Don’t want your chart to look like this? Adopt clean chart analysis!
Candlestick patterns
Candlestick patterns, such as doji, engulfing patterns, and pin bars, identify potential trend reversals, continuation patterns, and market sentiment. Traders use these patterns to make decisions about entering or exiting trades.
Support and resistance levels
Support and resistance levels are key price action indicators that help traders identify areas where the price will likely reverse or stall. These levels are based on historical price movements and can be used to set entry and exit points for trades.
Trend lines
Trend lines are drawn on a chart to connect the highs or lows of price movements, helping traders identify the direction of the trend. Trend lines can also act as dynamic support or resistance levels.
Price action patterns
Price action patterns, such as head and shoulders, double tops and bottoms, and triangles, provide insights into potential market movements and can be used to make trading decisions.
Moving averages
While moving averages are a more traditional technical indicator, they can also be considered a price action indicator when used to identify trends and potential support or resistance levels.
Price action indicators are popular among forex traders because they provide a clear visual representation of market dynamics and can be used to make informed trading decisions based on current price movements. By understanding and interpreting price action indicators, traders can gain valuable insights into market sentiment and potential future price movements.
Price Action Trading & SMC Strategies
I think it’s time to get strategic. I will focus on the strategies you can apply for the two aforementioned types of trading: price action and smart money concepts.
Pin bar reversal strategy
This strategy is based on identifying pin bar candlestick patterns – a long wick and a small body – that form at key support or resistance levels, as well as at trend lines or after a strong move in the market.
This strategy will require looking for a pin bar that has formed significantly on the chart and then waiting for confirmation of a potential reversal. The latter can come as a price rejection at the level, a strong close beyond the pin bar, or a subsequent candle confirming the reversal.
Once you have identified a valid pin bar and confirmed reversal, you can enter a trade in the direction of the reversal. Place a stop-loss beyond the high or low of the pin bar, depending on the direction of the trade.
The pin bar reversal strategy is popular among forex traders because it provides a clear entry and exit strategy based on price action indicators. You can use it with other technical analysis tools for increased efficiency. However, as with any trading strategy, you’re better off practicing risk management and thoroughly backtesting and demo-trading the strategy before implementing it in live markets.
Order flow analysis
Institutional order flow analysis involves monitoring large institutional traders' volume and price movements, such as banks, hedge funds, and other financial institutions, to identify potential market trends and reversals.
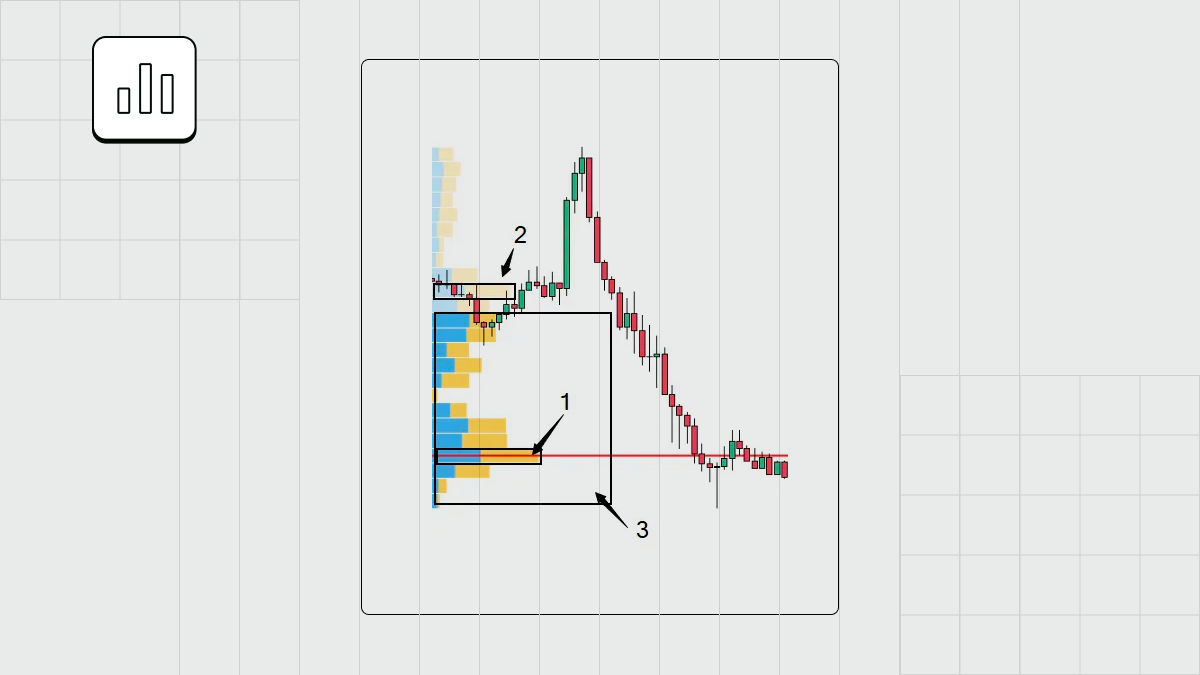
This type of strategy relies heavily on tools such as volume profile indicators, order flow analysis software, and market depth data to track institutional traders' buying and selling activity. To predict where the market is going, you will need to analyze the volume distribution at different price levels and identify areas of significant buying or selling pressure. For example, you can use Horizontal Volume Indicator as it’s many traders’ one of the top choices.
You can also pay attention to price action around key support and resistance levels and major news events and economic releases that may impact institutional trading behavior.
Institutional order flow analysis will help you make more informed decisions and capitalize on market movements driven by large institutional players. However, and I cannot stress that enough, the strategy requires a deep understanding of market dynamics and may also need access to specialized tools and data sources. Finally, as with any trading strategy, don’t neglect risk management and thorough testing.
Conclusion
Clean charts price analysis is a skill every trader should master. Its advantages are undeniable: when you analyze clean price charts, you don’t get distracted by unnecessary info noise while focusing on what really matters.
Try to apply this type of Forex charts analysis in your everyday trading. As soon as you find your way with it, you will notice positive changes in the trading process. It will become smoother, giving you control over what’s happening. As a result, you will get better at trading Forex.
For more information on how to analyze Forex charts, feel free to browse through FBS tutorials.
FAQ
How do you analyze a price chart?
The price chart consists of two axles: time and price. The time component of a price chart is read on the x-axis (left to right), with each candlestick or bar representing a unit of time. The price of an instrument is read on the y-axis (top to bottom), with each candlestick or bar representing the open, high, low, and close prices. When you read a Forex chart, you track the price movement, i.e., how the price changes through different time periods.
Forex chart analysis is a fundamental skill for trading Forex. When you enter the market, you must learn how to analyze Forex charts to read price action, spot trends, and understand the market dynamics.
How do you analyze price action?
When you analyze price action, two main factors to consider are the direction of the price and the direction of the volume. If an asset’s price increases while the volume increases, this indicates strong market conviction as many investors are buying at the higher price. Conversely, if the volume is low, the price action may not be as convincing because fewer investors choose to invest at the current price level.
How do you chart prices?
Forex chart analysis offers the four most common price chart forms: Line Chart, Bar Chart, Candlestick Chart, and Point and figure Chart. Each chart type can be used for specific purposes or considered more or less “readable”, as different traders have different preferences regarding which chart they feel more comfortable with.
How do you read a currency chart?
In a Forex currency pair, the first currency listed is the base currency, and the second is the quote currency. For example, in the EURUSD pair, the Euro is the base currency, and the US dollar is the quote currency.
The exchange rate between the two currencies is expressed as the amount of quote currency required to buy one unit of the base currency. So, if the EURUSD pair is trading at 1.20, it means that 1 euro is equal to 1.20 US dollars.


